
- Like
- SHARE
- Digg
- Del
- Tumblr
- VKontakte
- Flattr
- Buffer
- Love This
- Save
- Odnoklassniki
- Meneame
- Blogger
- Amazon
- Yahoo Mail
- Gmail
- AOL
- Newsvine
- HackerNews
- Evernote
- MySpace
- Mail.ru
- Viadeo
- Line
- Comments
- Yummly
- SMS
- Viber
- Telegram
- JOIN
- Skype
- Facebook Messenger
- Kakao
- LiveJournal
- Yammer
- Edgar
- Fintel
- Mix
- Instapaper
- Copy Link

A messy desk mimics sloppy thinking. Photo by KEN IRWIN (Photo by Fairfax Media via Getty … [+] Images/Fairfax Media via Getty Images via Getty Images)
Fairfax Media via Getty Images
Economists simply cannot leave raw data alone. They tweek away with odd goals. Then, they make those tinkered numbers the official ones, locking in their perspective while ignoring and even hiding the actual data.
Compounding the problem is the media’s race to be first with “breaking news.” By quickly regurgitating the flawed numbers, they offer no added value. Moreover, the widespread dissemination of those numbers connotes acceptance and popularity. That, in turn, produces groupthink conjectures without having to lift a mental finger.
To understand abnormal times, like now, ignore the economists’ altered data.
The GDP data has been mistakenly and misleadingly described
The best way to understand what the GDP data is revealing is to start at the ground floor.
In the table below, the actual quarterly GDP amounts are the source of analysis. Actual means:
Not seasonally adjusted – Seasonal adjustment only works for normal times. In abnormal ones like now, increasing or decreasing actual numbers alters reality
Not annualized – Annualizing monthly or quarterly numbers is popular with economists, but can be highly misleading to everybody else. Unfortunately, the media spreads the data about. For example, in The Wall Street Journal (October 30), the front-page article about GDP included a graph of annualized, fully adjusted quarterly numbers. It labeled the two latest quarters as $17.3T (2nd quarter) and $18.58T (3rd quarter). How are those numbers derived? By multiplying the fully adjusted quarterly numbers by 4! So, why do that? Because economists are used to thinking in annual terms. The media should ignore that preference and report what everybody else thinks when they see, “Third quarter = $xxxT.”
Not inflation adjusted – Like seasonal adjustment, inflation adjustment during recessionary times can be flawed. Moreover, for investors, analyses using GDP growth often include non-inflation adjusted data like sales, earnings and investment returns. (And remember, economists never inflation-adjust those “zero” interest rates. Imagine the reaction if negative “real” returns were widely known and understood by savers and investors.)
However, that’s not the worst of it. The WSJ‘s footnote is incomplete: “Seasonally [sic] and inflation adjusted at annual rates.” How is the inflation adjustment done? By revaluing the current GDP number in 2012 dollars! The “GDP implicit price deflator” for 2012 dollars is now 113.849, meaning the actual third quarter 2020 GDP amount of $5.318T is divided by that deflator, thereby reducing it by over 12% to $4,680T. That is not a real number. Clearly, The Wall Street Journal reporter and editor don’t understand that, so all the discussion and analysis is suspect.
What should have been done? Not what the Commerce Department reports. Their worked over numbers need to be reworked. If inflation adjustment is desired, it needs to start with the latest value being the actual amount, then applying the deflator backwards, putting everything in 2020 dollars. Of course, doing so means the past numbers are forever changing as time moves forward. But, then, that’s why the media need to do something more than typeset one or two numbers and call it a day.
Okay, enough of that. Here’s what’s really happening to the GDP:
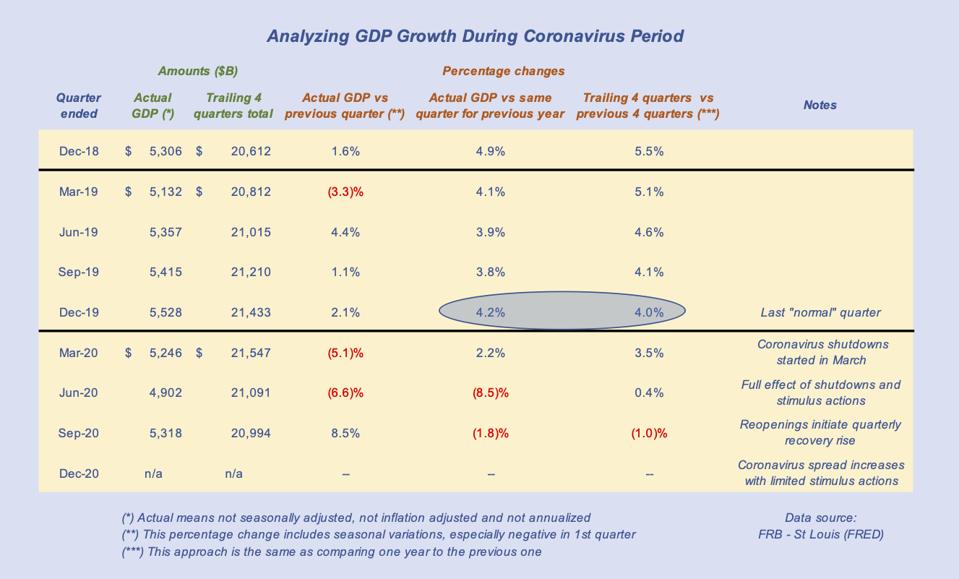
Recent actual GDP numbers and associated growth rates
John Tobey (FRB of St Louis – FRED)
The next step: Put 2020’s GDP results in historical perspective
Fortunately, we have the Great Recession for comparison. This graph shows the actual quarterly GDP data and the two annual growth rate calculations from 2004. Clearly, the extent of the 2020 GDP drop is like the Great Recession’s, but the coronavirus shutdowns had been expected to be reversed quickly. With the stock market selloff, those expectations are getting revisited. Therefore, that third quarter bump, while positive, requires the fourth quarter GDP to follow through.
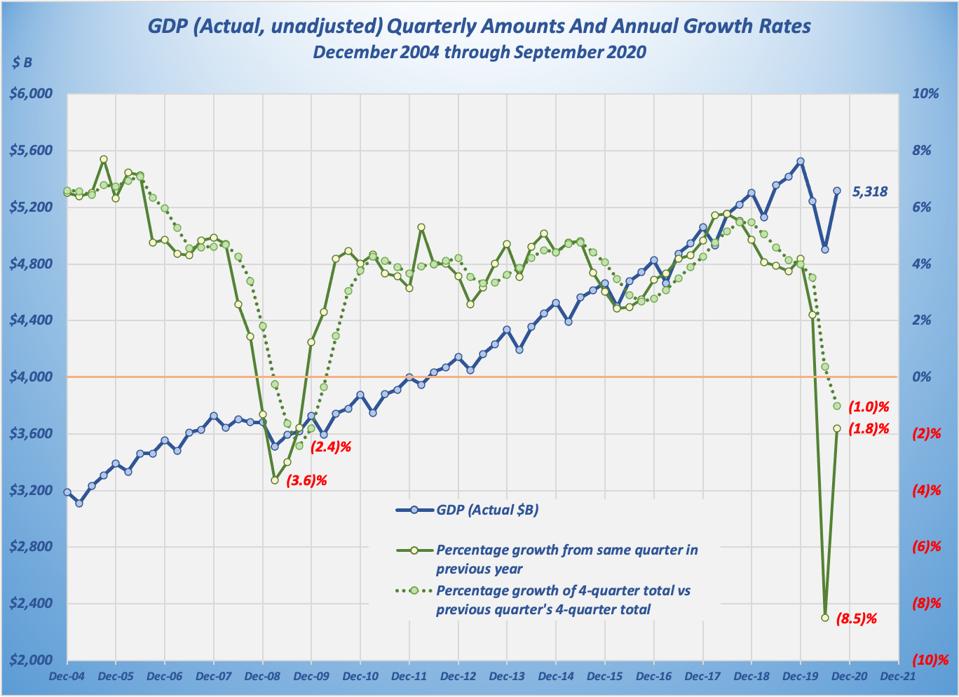
Actual quarterly GDP overlaid by two annual rates
John Tobey (FRB of St Louis – FRED)
The bottom line: GDP data, so important and so mishandled, show the need to dig in and engage with the actual numbers
If The Wall Street Journal can’t furnish the fulsome information and analysis we need, it means we must look elsewhere or do our own work. It’s a frustrating situation to have so much data and commentary easily accessible, yet have so little real fundamental analysis being done.

