
- Like
- SHARE
- Digg
- Del
- Tumblr
- VKontakte
- Flattr
- Buffer
- Love This
- Save
- Odnoklassniki
- Meneame
- Blogger
- Amazon
- Yahoo Mail
- Gmail
- AOL
- Newsvine
- HackerNews
- Evernote
- MySpace
- Mail.ru
- Viadeo
- Line
- Comments
- Yummly
- SMS
- Viber
- Telegram
- JOIN
- Skype
- Facebook Messenger
- Kakao
- LiveJournal
- Yammer
- Edgar
- Fintel
- Mix
- Instapaper
- Copy Link

Weekly charts are starting to show technical warnings.
getty
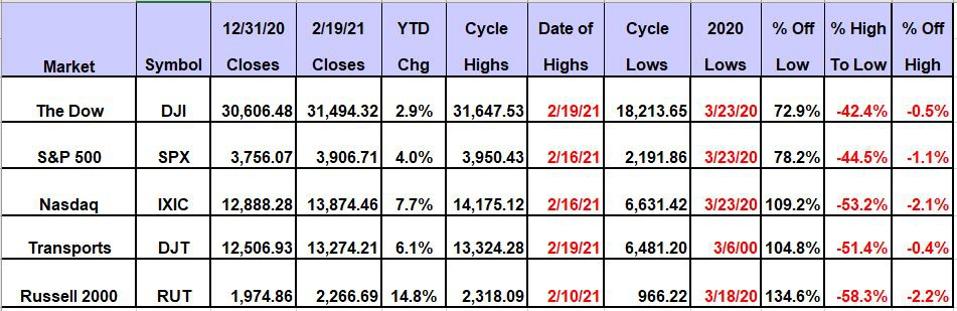
Four of the five major equity averages set all-time intraday highs last week. The Russell 2000 has the largest year-to-date gain but set its all-time high on February 10. The weekly charts are starting to show technical warnings which I explain below.
The Dow Jones Industrial Average set its all-time intraday high at 31,647.53 on February 19. This is between its semiannual and annual risky levels at 31,459 and 33,425 where profits should be taken. The S&P 500 set its all-time intraday high of 3,950.43 on February 16. This put the index above its annual risky level at 3,932.35 where profits should be taken.
The Nasdaq Composite set its all-time intraday high of 14,175.12 on February 16. Its monthly pivot at 13,804 is now a magnet. The Dow Jones Transportation Average set its all-time intraday high of 13,324.28 on February 19. The high was between its monthly pivot at 12,650 and its annual risky level at 14,424. The Russell 2000 Index set its all-time intraday high of 2,318.09 on February 10. The high was well above its annual risky level at 2,120.34 which is now a pivot.
The Russell 2000 is outperforming
Global Market Consultants
A reason to be concerned about the stock market is the size of margin debt, which reached a record high at the end of January. If the market starts to decline more significantly, there will be margin call selling. This was a major factor in the stock market decline in the first quarter in 2020.
The weekly chart for the Dow Jones Industrial Average is positive but overbought. The Dow is above its five-week modified moving average at 30,830. Its 200-week simple moving average lags at 25,624. The 12-week slow stochastic reading is overbought at 86.85. My proprietary analytics shows quarterly, and semiannual pivots at 31,052 and 31,459, with an annual risky level at 33,425.
The weekly chart for the S&P 500 is positive but overbought. The S&P is above its five-week modified moving average at 3,814.86. Its 200-week simple moving average lags at 2,910.79. The 12-week slow stochastic reading is overbought at 89.63. A reading above 90.00 would put the S&P 500 in an inflating parabolic bubble. My proprietary analytics shows a semiannual value level at 3,511.43 with a quarterly pivot at 3,836.19, and an annual risky level at 3,932.35.
The weekly chart for the Nasdaq Composite is positive but extremely overbought with the index above its five-week modified moving average at 13,389.08. Its 200-week simple moving average lags at 8,334.70. The 12-week slow stochastic reading is extremely overbought at 92.37. The reading above 90.00 puts the Nasdaq in an inflating parabolic bubble. My proprietary analytics shows quarterly, annual and semiannual value levels at 12,789.26, 12,000.71 and 10,972.72, respectively.
The weekly chart for the Dow Jones Transportation Average is positive with the average above its five-week modified moving average at 12,802.26. Its 200-week simple moving average lags at 10,386.58. The 12-week slow stochastic reading is rising at 73.99. My proprietary analytics shows semiannual and quarterly pivots at 12,314.56 and 12,003.69, with an annual risky level at 14,424.55.
The weekly chart for the Russell 2000 Index is positive but extremely overbought with the index above its five-week modified moving average at 2,137.00. Its 200-week simple moving average lags at 1,557.38. The 12-week slow stochastic reading is extremely overbought at 93.10. The reading above 90.00 puts the Russell 2000 in an inflating parabolic bubble. My proprietary analytics shows quarterly and semiannual value levels at 1,840.34 and 1,711.55, with an annual pivot at 2,120.34.

