
- Like
- SHARE
- Digg
- Del
- Tumblr
- VKontakte
- Flattr
- Buffer
- Love This
- Save
- Odnoklassniki
- Meneame
- Blogger
- Amazon
- Yahoo Mail
- Gmail
- AOL
- Newsvine
- HackerNews
- Evernote
- MySpace
- Mail.ru
- Viadeo
- Line
- Comments
- Yummly
- SMS
- Viber
- Telegram
- JOIN
- Skype
- Facebook Messenger
- Kakao
- LiveJournal
- Yammer
- Edgar
- Fintel
- Mix
- Instapaper
- Copy Link

Stock market on target
It was another good week for the stock market, as many of the market averages made further new highs. After the April 1 surge by the S&P 500 above 4000, this was certainly not surprising. It was also a good week for the European markets, as the German DAX and the STOXX Europe 600 both made new all-time highs last week.

Markets
For the second week in a row, the Nasdaq 100 ($NDX
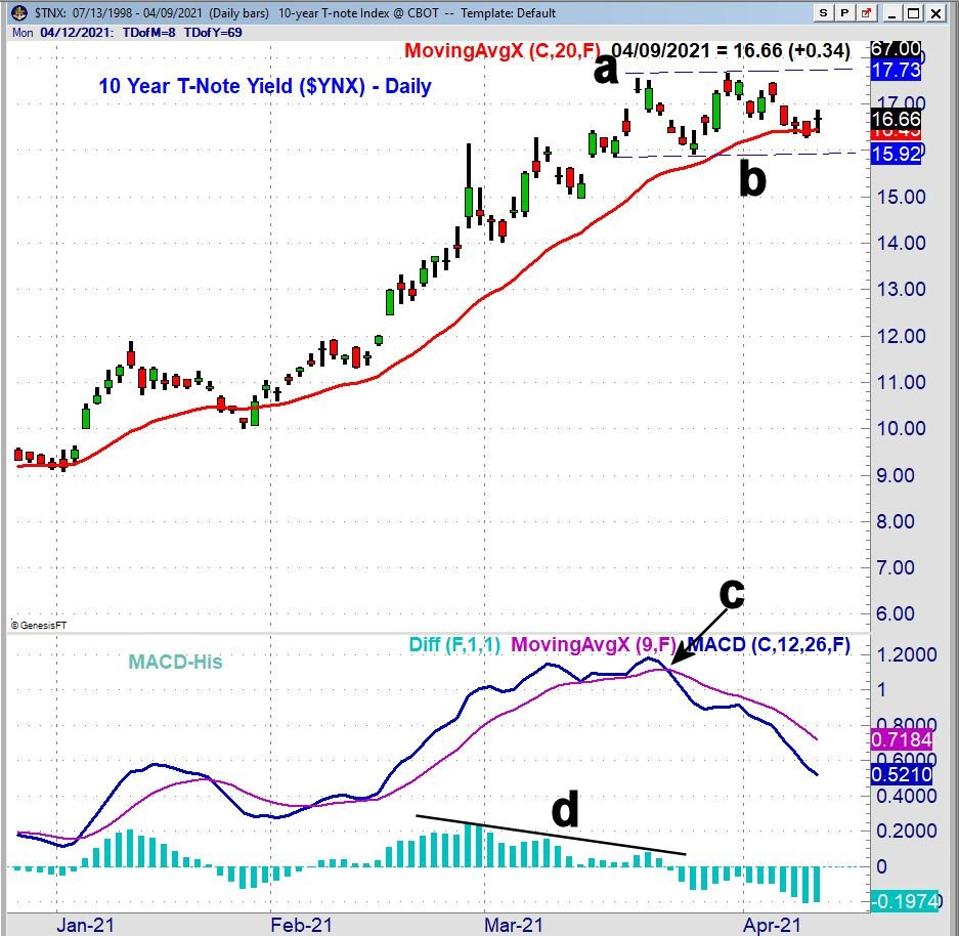
10 Year T-Note Yield
Gold may have gotten a boost from the week’s slight decline in the yield of the 10 Year T-Notes. The daily chart shows what appears to be a continuation pattern, which is a pause in the trend of higher yields (lines a and b). A close in yields above 1.773% will project a move to the 1.950% area.
The daily Moving Average Convergence-Divergence (MACD) turned negative on March 23 (point c) as the MACD-Histogram had been diverging from yields since late February (line d). The weekly MACD and MACD-His are still positive, so the negative readings from the daily indicator are consistent with just a pause in the uptrend.
Growth Value
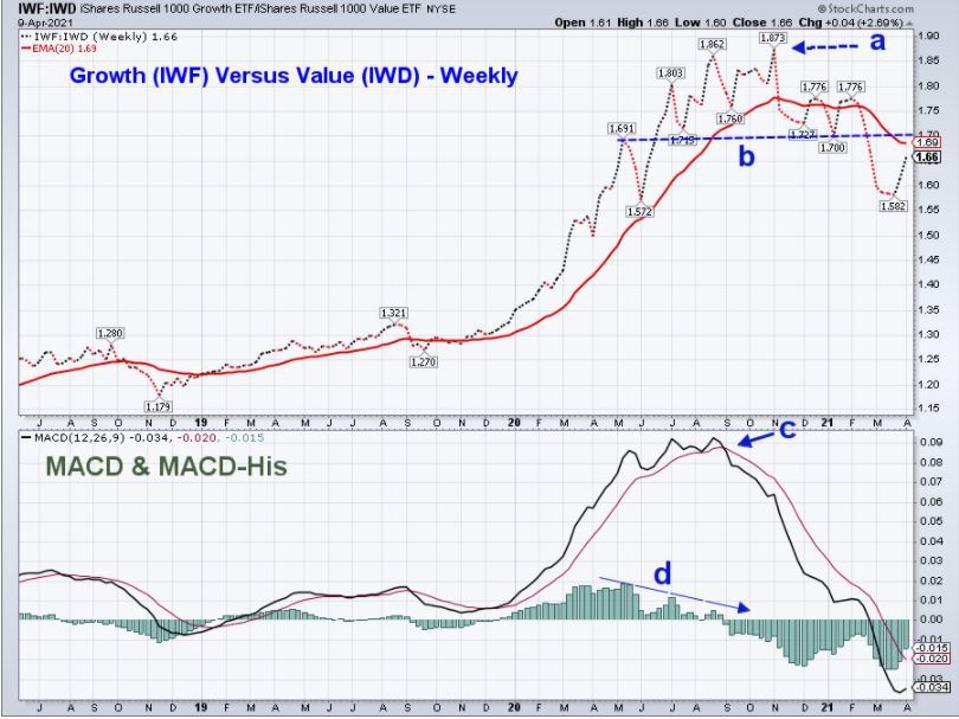
Last week’s gain in the growth-heavy Nasdaq 100 showed a second week in a row where growth has outperformed value. One useful way to evaluate the performance of growth versus value is to use the iShares Russell 1000 Growth (IWF)
The weekly chart of this ratio shows that it made its high on November 2 (point a), when the value of IWF (growth) was 1.873 times that of the IWD (value). The top was completed in February as the important support (line b), was broken. This former support, which is now resistance, could be reached in the next few week. For now, the rebound looks to be part of the topping process.
The weekly MACD turned negative in September and was declining steadily, as the ratio made its high. The MACD-His peaked in May 2020 and diverged from prices (line d) until it also turned negative. Both have risen recently, but show no signs yet of a bottom.
The stock market is getting ready for the start of the earnings season this week, as JPM
The outlook for earnings is quite positive, as Factset is looking for an estimated earnings growth rate of 24.5% in the S&P 500. That would be the largest gain in any quarter since 2018. Price/Earnings ratios are also at historic highs, with “the forward 12-month P/E ratio for the S&P 500 is 22.4” which is well above “the 10-year average (15.9)”.
There seems to be a consensus on which sectors will show the largest profits. Caroline Valetkevitch at Reuters reports “Financials are expected to show one of the biggest earnings gains, up 75.6% year-on-year, while materials are seen up 45.4%.” In addition, FactSet is also looking for double-digit earnings growth in nine of the ten industry groups that make up the Consumer Discretionary Sector. Last week, I discussed the very encouraging numbers on Consumer Confidence. The seasonal trend in April also favors these three sectors.

Vanguard Financial ETF (VFH)
My favorite financial ETF is the Vanguard Financial ETF (VFH)
VFH was up 1.7% last week and is not far below the all-time high at $87.56. The weekly starc+ band is at $92.01. The rising 20-week exponential moving average (EMA) was almost reached in January and is now good support at $78.26. The relative performance (RS) turned higher last fall as it moved above its weighted moving average (WMA). The RS overcame the resistance (line a) in February, which confirmed that VFH was a market leader. The On Balance Volume (OBV) moved above its WMA in November and has been leading prices higher in 2021 as it made a new high last week.

S&P 500
The technical outlook for the S&P 500 is positive. After breaking out on April 1 and closing above $400, it overcame the monthly pivot R1 resistance at $406 the next day. The S&P closed at $411.49 on Friday with the monthly R2 resistance at $415.39. The rising 20-day EMA at $398.33 is now first support which is 3.2% below Friday’s close.
The S&P 500 Advance/Decline line has been leading prices higher in 2021, as it broke out to the upside at the start of the month and also made a new high last week. It is getting far above its rising EMA and is a bit extended on the upside.
And there are a few warning signs that the market is indeed overextended. In the latest survey from the American Association of Individual Investors (AAII), the Bullish % surged 11.1 points to 56.9% from 45.8% the prior week. That is the highest reading since January 4, 2018. Additionally, the percentage of S&P 500 stocks above their 50-day MA closed the week at 89%, which is one of the three highest readings in the last five years. It is also a concern that the Spyder Trust (SPY)
After the sharp gains so far in April, I would not chase prices. A pullback of at least 1-2% pullback seems very likely as we head into the earnings season. I will be watching the Growth/Value ratio in the next few weeks. As always, one should pay particular attention to the risk on any new positions.
In the Viper ETF Report and Viper Hot Stocks Report, I update subscribers with my market analysis at least twice each week and provide specific buy and sell advice. Each report is just $34.95 per month. New subscribers also receive six free trading lessons, a $49 value.

